GameStop, Meme Stocks and Offline Store Visits
When GameStop (NYSE: GME) was all over the news earlier this year due to a short squeeze, largely driven by a Reddit community (i.e., the Meme Stock hype), I was thinking about the potential impact of this hype on GameStop’s offline (brick-and-mortar) business.
Not unlike impact of TV advertising on sales following large events such as the Super Bowl, one could assume that the hype around GameStop might have had a positive effect on their offline business. A potential mechanism of this hype may be that a consumer recalls GameStop and decides to visit one of their stores to purchase an item.
In order to answer this question, I analyzed store visit data from GameStop before and after the hype and compared it to a competing retailer. Weekly data on search volume from Google Trends shows that the peak of the hype was in the week of January 25, 2021, see figure below.[1] In that week, the trading volume was around 560 million shares (up from an average weekly trading volume of 32 million in 2020).

As of January 2021, GameStop had 3,192 stores in the US.[2] The following analysis focuses on a subset of 2,517 stores that were consistently open for business between January 2019 and May 2021. The figure below shows the mean of weekly store visits.[3] It is important to note that the store visit data stems from a panel of mobile devices that aggregates about 10 percent of mobile devices in the US.[4] The number of depicted visits is hence just a fraction of actual visits. The analysis further assumes that the average in-store transaction value per customer has not significantly changed in the observed time frame. The figure indicates seasonal fluctuations, such as GameStop’s holiday business, extreme weather events and COVID disruptions, but it is too imprecise to show any changes in offline store visits the weeks following the hype (starting from the week of January 25, 2021).

I further compare the year-over-year-over-year (i.e., 2019, 2020 and 2021) differences in mean store visits in the first 9 weeks of each year. The analysis starts from the second week of each year up to week ten. As indicated, the focal week (hype week) was week 5 (starting from January 25, 2021).
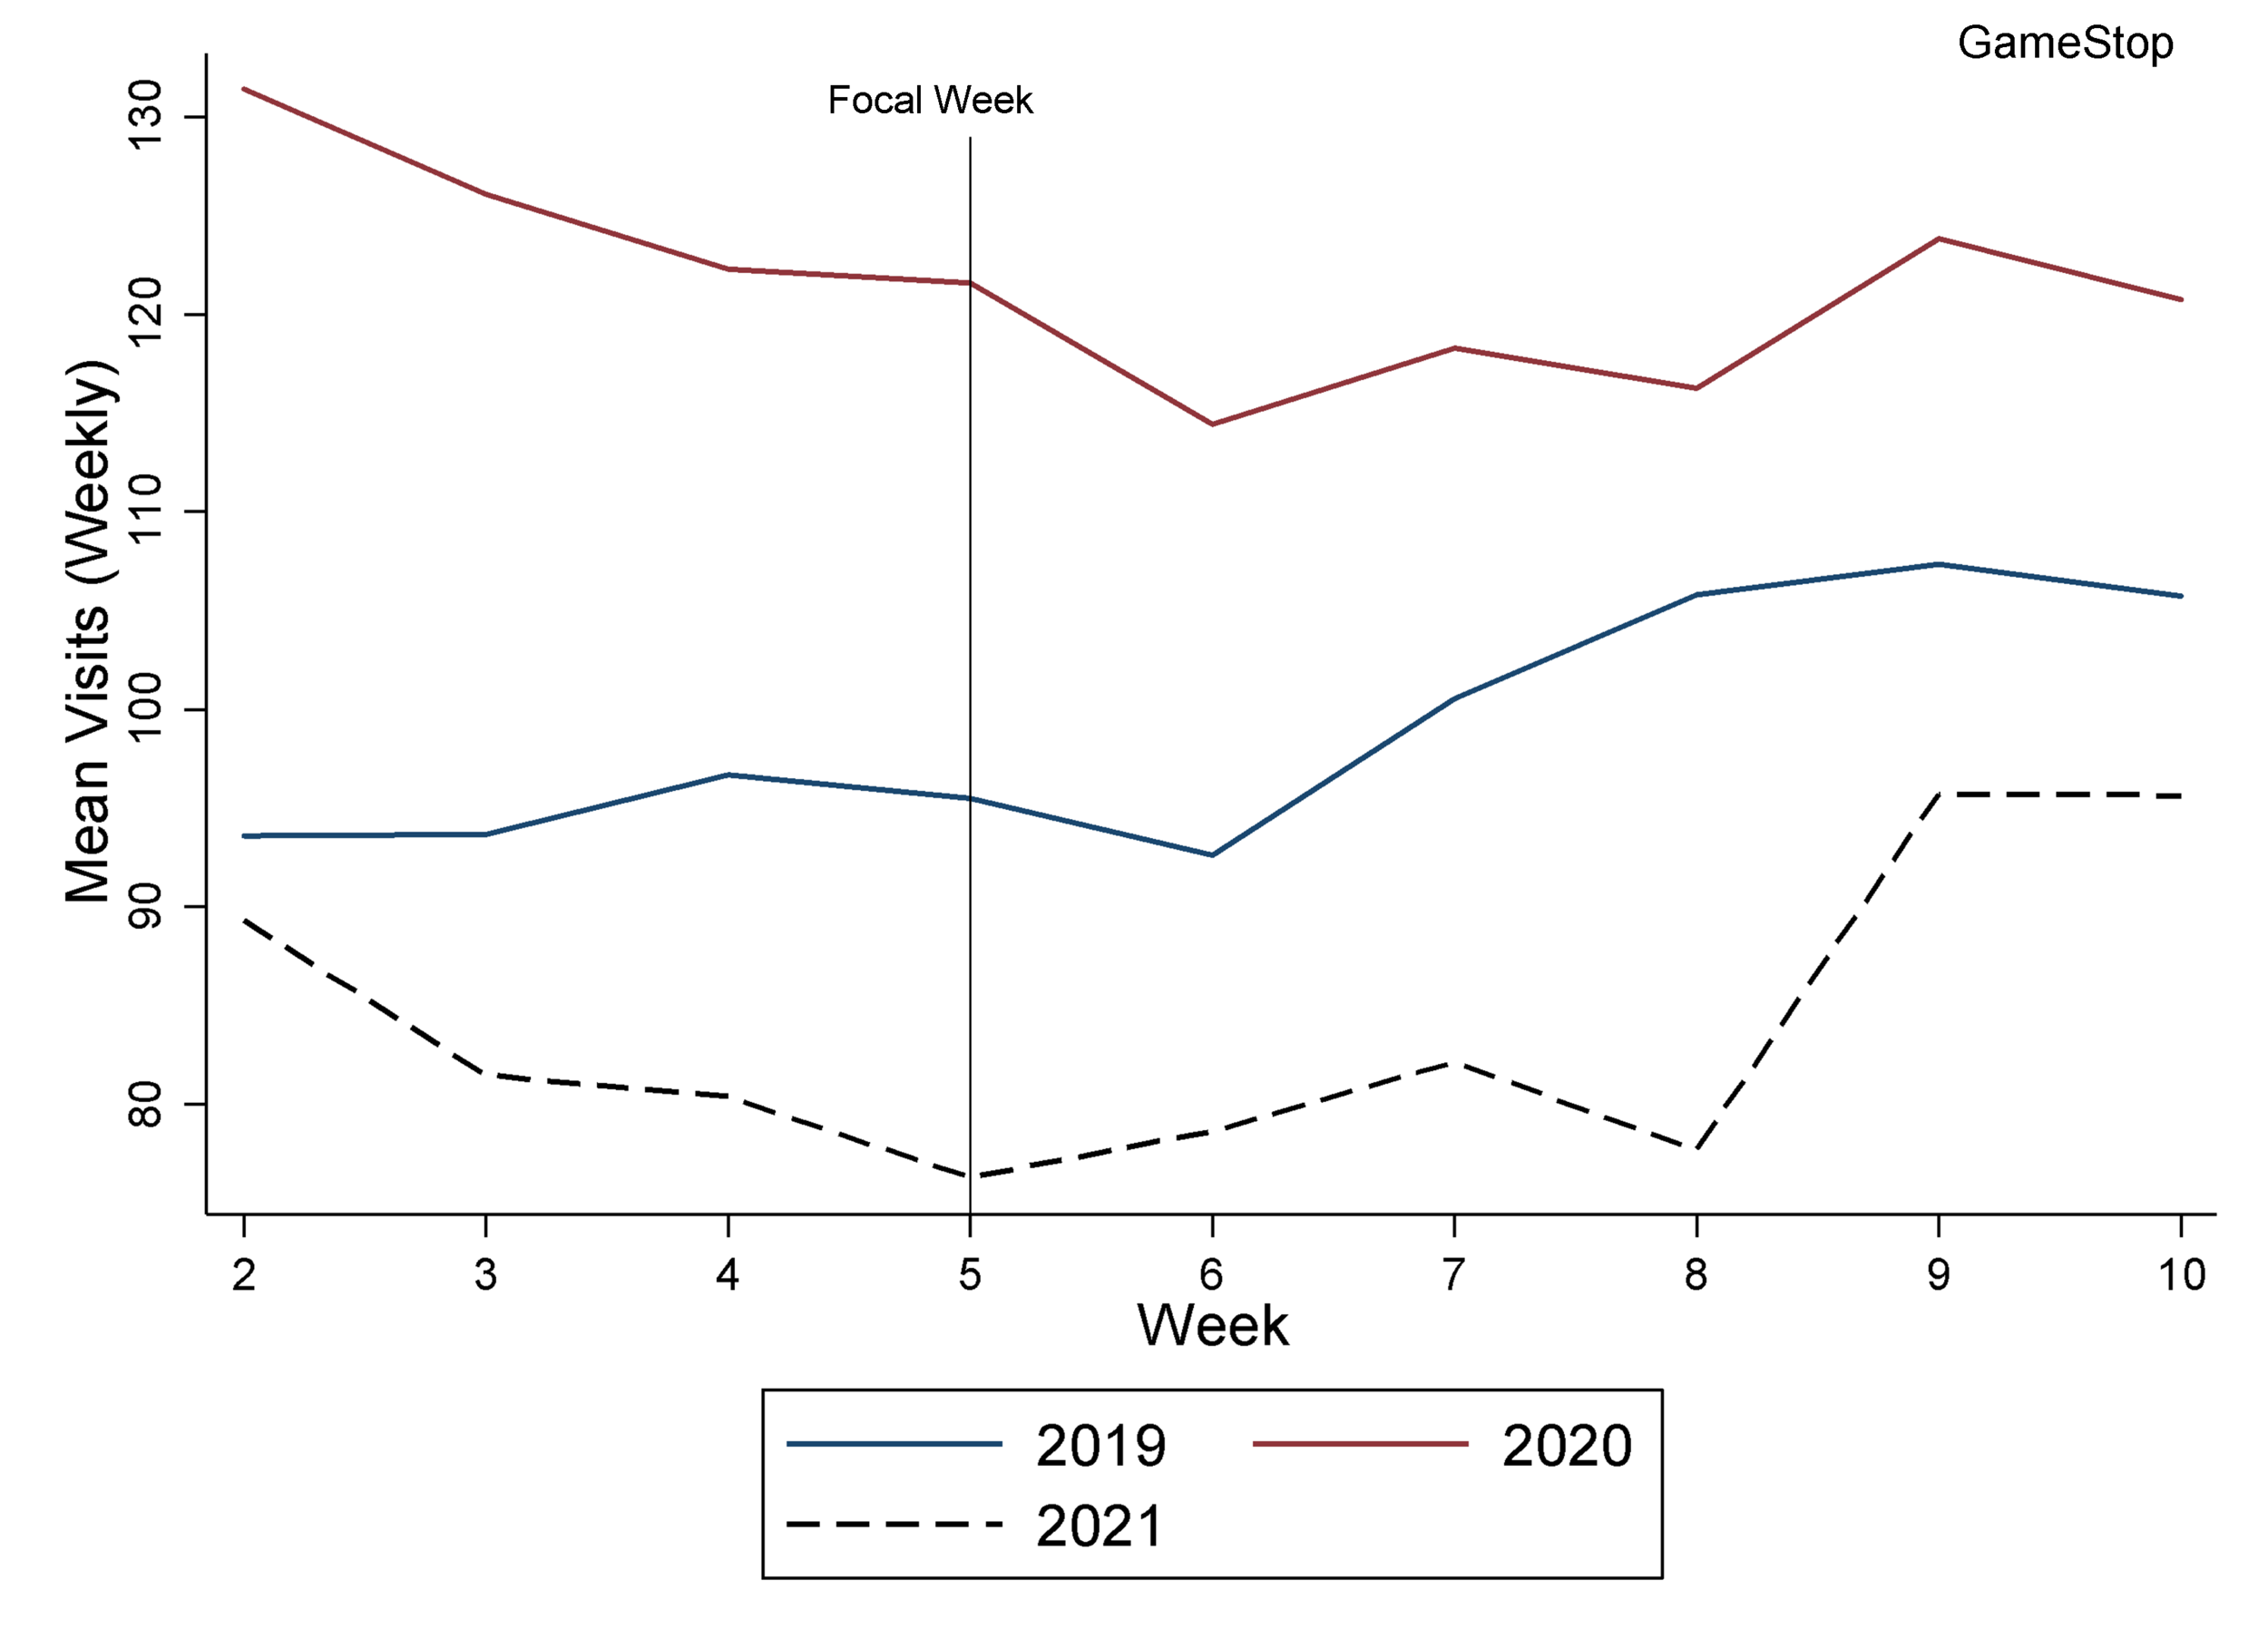
The figure above indicates no significant increase in average store visits following the first three weeks after the hype in week 5. However, starting from week 9 (February 22) there was significant increase in store visits compared to the prior weeks. This increase is similar (albeit larger in percentage terms) to the increase in store visits between week 6 and week 8 in 2019. Without further analyses, it is hard to attribute the increase in week 9 (2021) to the hype around GameStop.
Fortunately, a quick look at Best Buy (that offers a variety of similar products) allows me to investigate the presence of parallel or seasonal trends. Similar to GameStop, the figure below shows the year-over-year-over-year differences (2019-2020) in mean store visits for the first 9 weeks of each year for Best Buy, including 822 stores that were constantly open between January 2019 and May 2021.
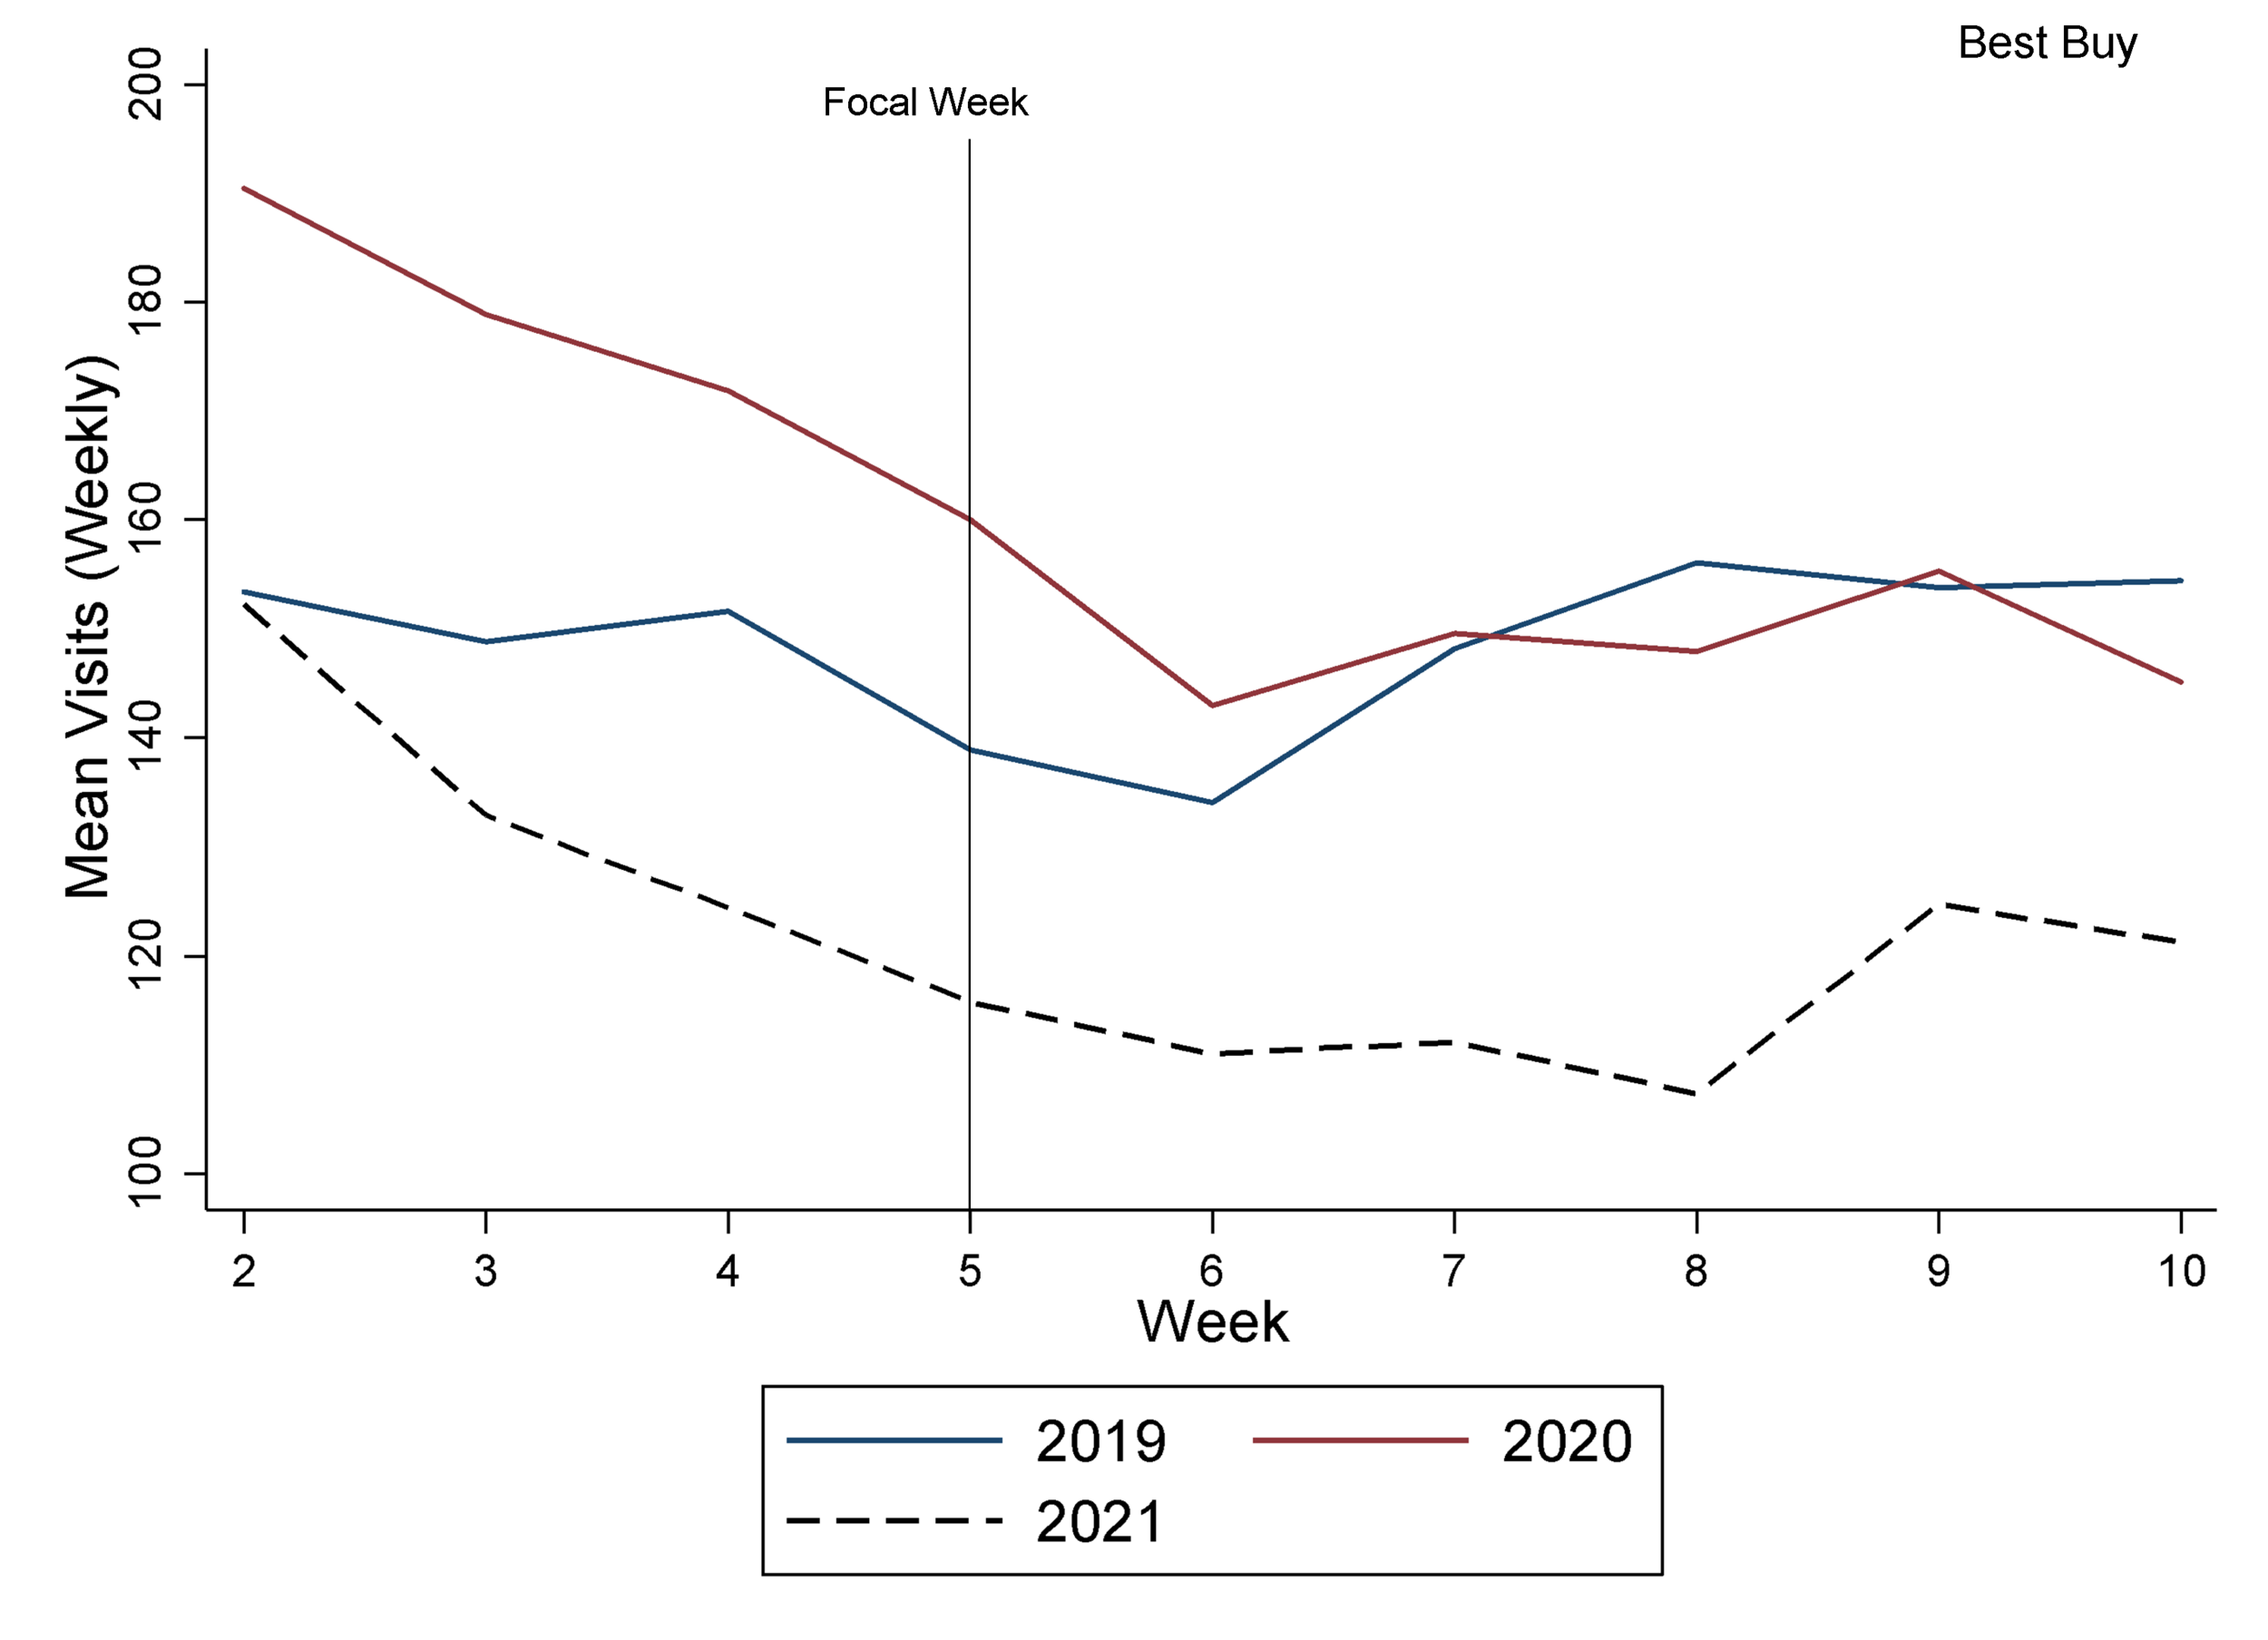
This figure also shows a significant increase in average store visits in week 9 compared to the prior weeks. This provides some evidence that the increase might rather be attributed to a seasonal trend, possibly in anticipation of the stimulus payment that started in week 12 (March 17, 2021).
To summarize, it is unlikely that hype around GameStop earlier this year led to a significant increase in offline store visits, at least in the short term. Potential long-term effects will be harder to measure. Also, given that the pandemic is still around, GameStop’s online business may have benefited more from the hype, which is beyond this analysis.[5]
Update: GameStop’s revenue in Q1 2019 was $1.5 billion, $1.02 billion on Q1 2020 and $1.28 billion in Q1 2021. [6, 7, 8]
[1] The bump in search volume in November 2020 may be related to the Black Friday/Cyber Monday sales events.
[2] https://www.statista.com/statistics/1209594/number-of-gamestop-outlets-in-the-us/
[3] The mean store visits from January to May were 106 in 2019, 89 in 2020 and 93 in 2021.
[4] https://www.safegraph.com/blog/what-about-bias-in-the-safegraph-dataset
[5] GameStop’s share of online sales grew from 5% in 2019 to 30% in 2020.
[7] https://news.gamestop.com/news-releases/news-release-details/gamestop-reports-first-quarter-results