Smartphone Interfaces and Location-based Advertising
There are now more than 4 billion people in the world that own a smartphone.[1] Smartphones have long outgrown the global installed base of PCs, which ranges around 1.5 billion. But what is different about smartphones?[2]
Compared to desktop PCs or laptops, smartphones are truly personal devices. Enabled by the devices’ size and mobile internet access, they can be used almost anywhere and anytime. The device itself also has unique characteristics, for example, the touch interface and the availability of various sensors (such as GPS or the accelerometer). Such sensors allow to pinpoint the geographic location of a device.[3] Overall, the collection of these characteristics are assumed to massively alter the interaction between consumers and firms, for example in the context of mobile advertising.
Firms, especially brands and retailers, have been experimenting with different types of mobile advertising.[4] One of these types of advertising is location-based advertising (LBA). LBA helps firms to target consumers in the vicinity of stores in real-time. A key motivation for firms to use LBA is that geographic proximity may increase the relevance of ads for consumers and the effectiveness of advertising campaigns. While that sounds straightforward, it is not necessarily clear how to best present LBA campaigns on a mobile interface. Two interface-specific aspects that likely affect the effectiveness of LBA are 1) the availability of distance information and 2) the distance-based ranking of LBA campaigns.
A recently published paper (“The Effectiveness of Location-Based Advertising and the Impact of Interface Design”) in the Journal of Management Information Systems, written by my co-authors Martin Spann, Anindya Ghose, Philipp Reichhart and me has investigated these aspects. We collaborated with a location-based service provider that belongs to a large telecommunications firm. By default, the provider’s app (which is similar to Groupon) presents coupons to consumers based on their real-time location (via GPS). Specifically, to study the availability of distance information on a device’s interface and the role of a distance-based ranking in LBA, we conducted a randomized field experiment. All treatment groups can be seen below:

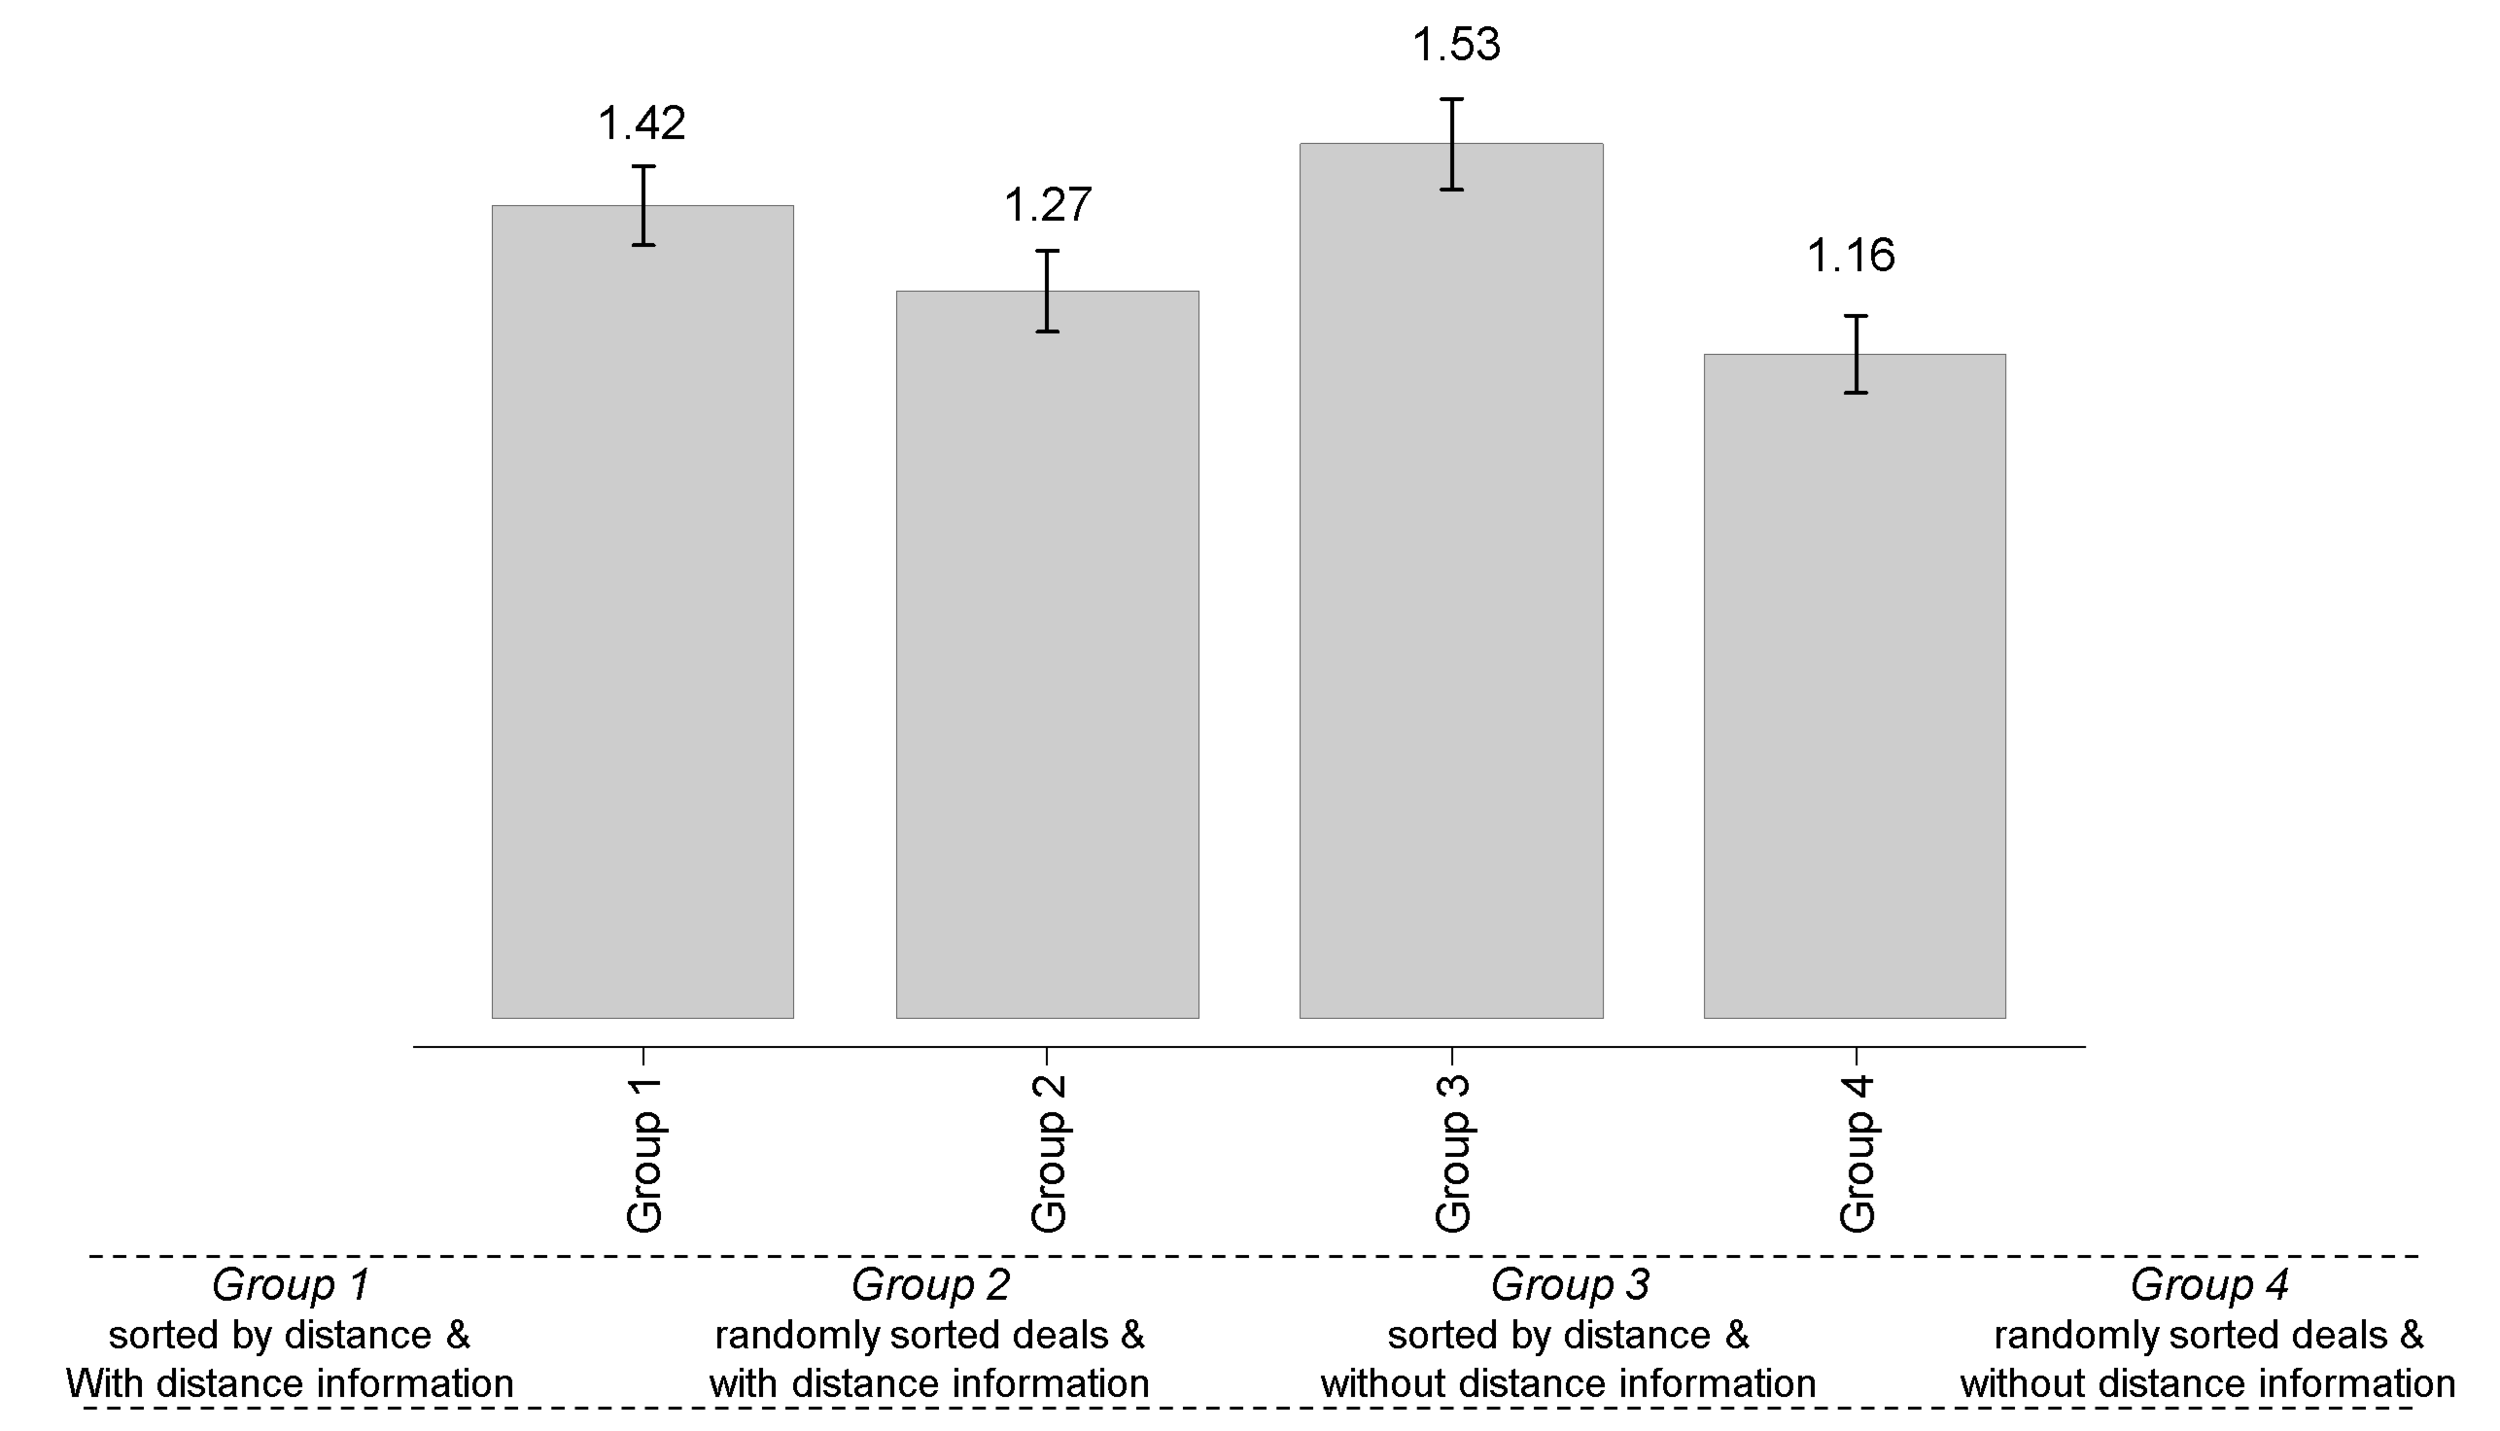
Group 1 is the default interface design (also beyond the experiment) and includes coupons that are ranked by distance (shortest distance first) with distance information (indicated in meters or kilometers). Group 2 includes coupons that are randomly ranked with distance information available. Group 3 includes coupons that are ranked by distance without explicit distance information. Finally, Group 4 includes coupons that are randomly ranked without distance information. Differences between Groups 1 and 2 (and Groups 3 and 4) allow to measure the effect of distance-based rankings on consumer responses. Differences between Groups 1 and 3 (and Groups 2 and 4) allow to measure the effect of distance information.
In total, 4,364 consumers participated in the field experiment. Upon downloading the app, consumer were randomly assigned to one of the four treatment groups: 1,317 to Group 1, 1,011 to Group 2, 1,036 to Group 3 and 1,000 to Group 4. These consumers generated 399,913 coupon impressions (observations). The impressions contain 3,499 different coupon promotions that were offered by 3,930 different venues located in 2,392 postal code areas.
Let’s look at the model-free results. The figure below shows the mean coupon click rates for all four treatment groups. . Altogether, 5,339 coupons were chosen, leading to an overall click rate of 1.35 percent. The mean click rates in Groups 3 (1.53 percent) and 1 (1.42 percent) are higher than those in Groups 2 (1.27 percent) and 4 (1.16 percent), indicating that the most effective interface design for location-based coupons is based on a distance-based ranking.
For us, these results were surprising in two ways. First, the difference in click rates between Group 1 and 3 (both are based on a distance-based ranking) indicate that the click rate is lower when distance information is explicitly shown, as in Group 1. We assume that the omission of distance information (e.g., “the store is 900 meters away”) may lead to an underestimation of the actual distance to stores in Group 3. Second, even in treatments without distance information, randomly ranked coupons (Group 4) resulted in lower click rates than coupons that were displayed in a distance-based ranking (Group 3). Consumers seem to have a general sense of a store's whereabouts in their vicinity.
The figure below additionally shows more detailed differences in click rates between groups at the display rank level (for the first ten ranked coupons). The results present a stark contrast between distance-based rankings (Groups 1 and 3) and random rankings (Groups 2 and 4).

When coupons are sorted by distance (see Groups 1 and 3), we find a stronger difference between the click rates by display rank (for example between rank 1 and 5). In contrast, if coupons are ranked randomly (see Groups 2 and 4), the click rates per display rank are almost uniformly distributed. This means in theoretical terms that the ranking or primacy effect is reduced when coupons are sorted randomly.
To summarize, distance-based rankings increase consumers’ likelihood to respond to location-based coupons. However, the availability of distance information only increases consumers’ response likelihood if coupons are ranked randomly.
Aside from the model-free results that are discussed in this post, we also estimated a hierarchical Bayes model that allows us to study the magnitude of distance and ranking effects by additionally accounting for heterogeneity across consumers. The published paper (“Effectiveness of Location-Based Advertising and the Impact of Interface Design“) can be found here.
Update: There is also a new video available that summarizes the paper.
[1] https://www.gsma.com/mobileeconomy
[2] …aside from a lower average product price; Global prices: 317 U.S. dollars in 2021 (smartphones) (link) vs. 632 U.S. dollars in 2019 (PCs) (link)
[3] For example, GPS sensors allow to track a smartphone’s location within a ~5-meter (16 ft.) radius: https://www.gps.gov/systems/gps/performance/accuracy/
[4] https://www.moengage.com/learn/examples-of-mobile-marketing-campaigns/